

Today we are excited to share some of the work we have been doing over the last few months to equip embedded development teams with great data and easy-to-access insights. We have made multiple improvements to our monitoring capabilities in particular, giving users more flexibility and more tools to help them understand the data they are getting and use it to inform decisions.
As IoT devices get more and more complicated, with more compute, performing more functions - ensuring reliability gets harder. Predicting how your devices are going to behave in the field also gets more difficult.
As a result of this complexity, the ugly truth is that every embedded engineering team will ship bugs at some point.
No matter how great your QA team is, how many tests you run, or how many dollars you invest in development, every IoT product will be shipped with bugs. Embedded systems expert Jack Ganssle estimates that even the best engineers can expect to introduce around 11 bugs per thousand lines of code.
Bugs aside, it's also pretty much impossible to ship perfect products the first time. There are always going to be areas for improvement. Maybe things you didn't get to before launch because you ran out of time, or maybe customers are using your products in ways you couldn't possibly anticipate. Since when has the real world ever been predictable?
Although frustrating initially, these things can present real opportunities as well, to improve, to learn and to delight customers. But to take advantage you have to know what's actually happening.
That's why we think being able to monitor (and update) devices after they are deployed in the field is crucial if you want to build great products, and it's a big part of the reason why Memfault exists.
As a company founded by embedded engineers, we want to give IoT device developers the same kind of tools that software teams in the cloud space have had for years now. Why shouldn't you have the ability to be responsive, to collect the same quality of information, and to prioritize and make decisions with confidence?
We want to help you make software the most reliable part of the IoT.
And that's why we’re excited to share these product updates designed to give you even more insight into the health and performance of your fleet.
Measure "Crashiness" in a single chart
We have been working on building a consistent way to measure software quality across devices - we are calling this “crashiness”. Our definition of crashiness is based on a calculation combining two metrics, the number of crashes (non-user-initiated reboots) over a set period of operational device hours. Both of these metrics are collected out of the box by our MCU SDK and the result of this calculation is what we are calling a crashiness score. This score gives you a nice, objective way to measure one of the biggest influencers of product quality and user experience - how frequently your devices crash.
The best thing - you can track it in one simple chart.
Want to know your softwares crashiness score and by extension, how likely your users are to experience a crash? Now you can. Lower the score, the more stable your software and the more reliable your devices are.
Once you have this score you can start measuring the performance of each software version you release in a standardized way. Compare crashiness score version to version and get your team focused on driving that number down. You could even use this measure to compare product to product across extended lifecycles.
Currently this feature is in Beta with some of our MCU customers and we are working to bring something similar for Linux and Android. Stay tuned for more on this soon.
Completely customizable dashboards
Memfault collects lots of extremely high-value data from your devices, giving you a picture of exactly what’s going on, at all times. This data covers everything from issue frequency to critical metric information such as battery level, connectivity status, and more. The combination of issue data and metric information at both a device and fleet-level gives you a complete picture of the state of your deployment.
Our new configurable dashboards enable you to combine all of these different data sources in a way that is completely customized to your specific use case. It also opens up endless possibilities for how you share this information with your team.
You can now build your own dashboards, add metric charts, issue charts and custom markdown cards and position or resize each piece to get the perfect layout.

Need to build a dashboard focused specifically on monitoring the rollout of your next software release? You can do that. Build a dashboard, add a live filter to limit the data only to your new release and keep track of issues while also showing how that release is impacting the battery performance of your devices, all right next to each other.

Perhaps you are responsible for product quality, and you want to know how your teams are tracking toward stated KPIs. You have a burn-down list of bugs, and you want to know how addressing those bugs is impacting product performance release to release. Maybe one of your top priority bugs is causing Bluetooth (BLE) disconnects. You can now build a dashboard dedicated to tracking BLE disconnections across several different timescales and data aggregations and compare your progress version to version.
Maybe you have multiple groups of devices, an internal testing group, a group for beta customers and a production group and you want to track the health of each distinct group separately? You can do that. Build a dashboard for each, group your devices using our cohorts functionality and then use the dashboard filter for cohorts to see data for just that group.
The possibilities are pretty endless and we can’t wait to see what our customers do with these new dashboards.
New Metric charts for better prioritization and comparison
Collecting data is only half the battle. You need to understand what it means once you have it. And this is often not as easy as it may sound. Sometimes it can be really difficult to understand if a problem affecting your devices (be it a specific crash or a performance issue), is affecting all of them, some of them or maybe even just one of them. We already have a load of useful data aggregations to help answer these questions, but now we also have percentiles aggregations, which makes it crystal clear.
Use percentiles aggregation and instantly understand if what you are looking at is one bad device throwing crazy readings or a whole load of devices acting outside of normal ranges. Combo this up with software version filters and you can get some pretty great insight super fast.

We also know that tracking performance improvements (or regressions) between versions can be really difficult when your fleet gets larger. It’s very unlikely that your whole fleet will pick up your new version all at once. So how can you be confident when you are making comparisons that you are making it across a reasonable sample size?
Our new population charts solve this problem.
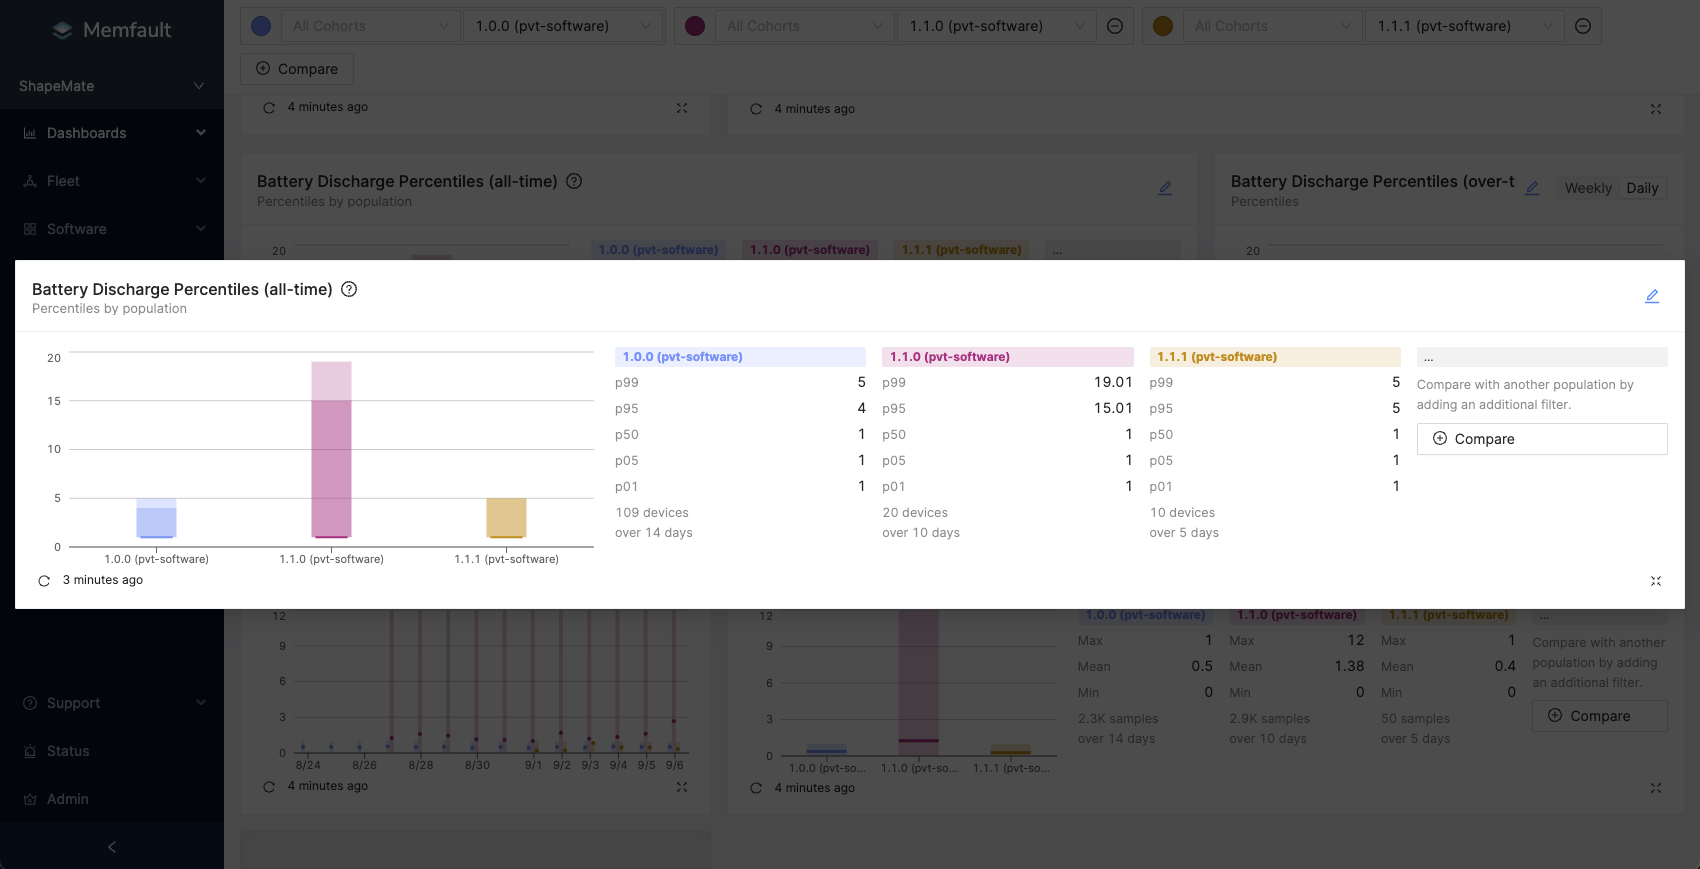
You can compare data across all time with filters for the exact populations and conditions you care about. This chart can be used either with Min/Mean/Max aggregation or Percentiles aggregation and gives you a full breakdown of the sample sizes contributing to your readings.
Want to compare all samples, across all time from one software version, to all samples from another version for a definitive comparison? Easy. You can even group multiple software versions together and make the same comparisons. All of 1.x versions vs all of 2.x versions? Also easy.
See metric data as soon as it's received
We have also made it possible to see health and performance metric data collected from your devices in our charts as soon as it’s received by Memfault. No delay, no waiting around. Get the most up-to-date picture as soon as you open your dashboard.
If you are monitoring that critical release rollout, you don’t want to wait to know if things are going wrong. Now you don’t have to. If something starts going wrong, you will see it right away, enabling you to take action fast and minimize the impact. Combine this with Memfault’s one-click release abort, and you have seriously fast response times to any problems with your next release.
Alerts exactly when you need them
The final piece of the monitoring puzzle is alerts. Although we would love it, our users probably don’t want to be staring at Memfault dashboards all day. And you shouldn’t have to. That’s why we have made a load of improvements to our alerts and notifications. We now allow users to configure the conditions that trigger an alert with more precision. By adding what we call a configurable “debounce period" to alerts you have much greater control over the conditions that cause an alert.
What does this mean? Well, let’s say you have an alert set for LTE disconnects, you want to know if a device is frequently disconnecting from LTE, but perhaps some LTE disconnects are expected in normal behavior of your device. You might expect it to disconnect once or twice an hour, but you wouldn’t expect it to disconnect for a whole day. You can now configure your alerts to account for this kind of behavior.
We want alerts to only get triggered when it really matters.

And in case you didn’t know, we also let you control exactly who gets a notification for each specific alert, and where they get that notification with our notification targets. Want to get a notification in your engineering Slack channel for some alerts and straight to your email for others? No problem.
Wherever you are and whatever you are doing, you can be confident that Memfault has your fleet covered, and if anything goes wrong you will know about it.
Want to find out more?
As you can probably tell we are very excited about these improvements and think the insights available can be truly transformative for companies developing IoT devices. In fact we are already seeing many of our customers take advantage of these features to change the way their company thinks about embedded device development.
If you want to hear more about how our customers are using Memfault to help them build better devices join us as we host our customer Latch, to tell us about how Memfault fits into their process. RSVP for the webinar here →